Decoding GAM Reporting

On September 21, 2026, Google turned off the legacy Reports tool in Ad Manager, and Google migrated no saved or scheduled legacy reports to Interactive reports automatically. New legacy report creation had already ended on March 2, 2026, which left teams roughly six months to rebuild report libraries that some had run for a decade. Every scheduled revenue email and every saved pacing report survived only where someone rebuilt it by hand.
We are OnlyMedia: an ad network, an SSP and an agency in one company, and we run Google Ad Manager, AdX and MCM for thousands of publisher partners, every site above one million monthly pageviews. The sunset applied to our networks the way it applied to everyone else's, which turns the migration into a shared case study in what reporting is for. The stack now runs on four access layers with different latency, granularity and cost, and knowing which layer answers which question is most of the job.
Two dates and one non-event
Two dates and one non-event define the migration. Google ended new legacy report creation on March 2, 2026, and Google turned off the legacy Reports tool on September 21, 2026. The non-event did the real damage: Google migrated no saved or scheduled legacy reports to Interactive reports automatically, so teams lost the automation, not the underlying data. Google publishes the transition details on its page about the migration to Interactive reports.
Treat the rebuild as an audit, not a port. List every saved and scheduled legacy report, write beside each the decision it feeds, and rebuild only the ones with a decision attached. Start with the scheduled reports because they carry deadlines: a scheduled report that stops sending shows up on someone's calendar within a week, while a saved report nobody opens never does. Rank the rebuild list by recipient, finance first, sales second, operations third, and send anything without a recipient to the archive instead of the rebuild queue.
Rebuild in code where you can. The Ad Manager API can create and run Interactive reports, so a report library can live in version control beside the rest of your infrastructure, with owners, diffs and a change history. A report that exists only in one analyst's browser history is a report the next migration will kill.
The metrics that decide arguments
Three numbers settle most publisher disputes: fill rate, match rate and viewability. Each has an official formula, and each hides a denominator that changes the story. Quote the formulas, not the folklore.
Fill rate: two denominators, one name
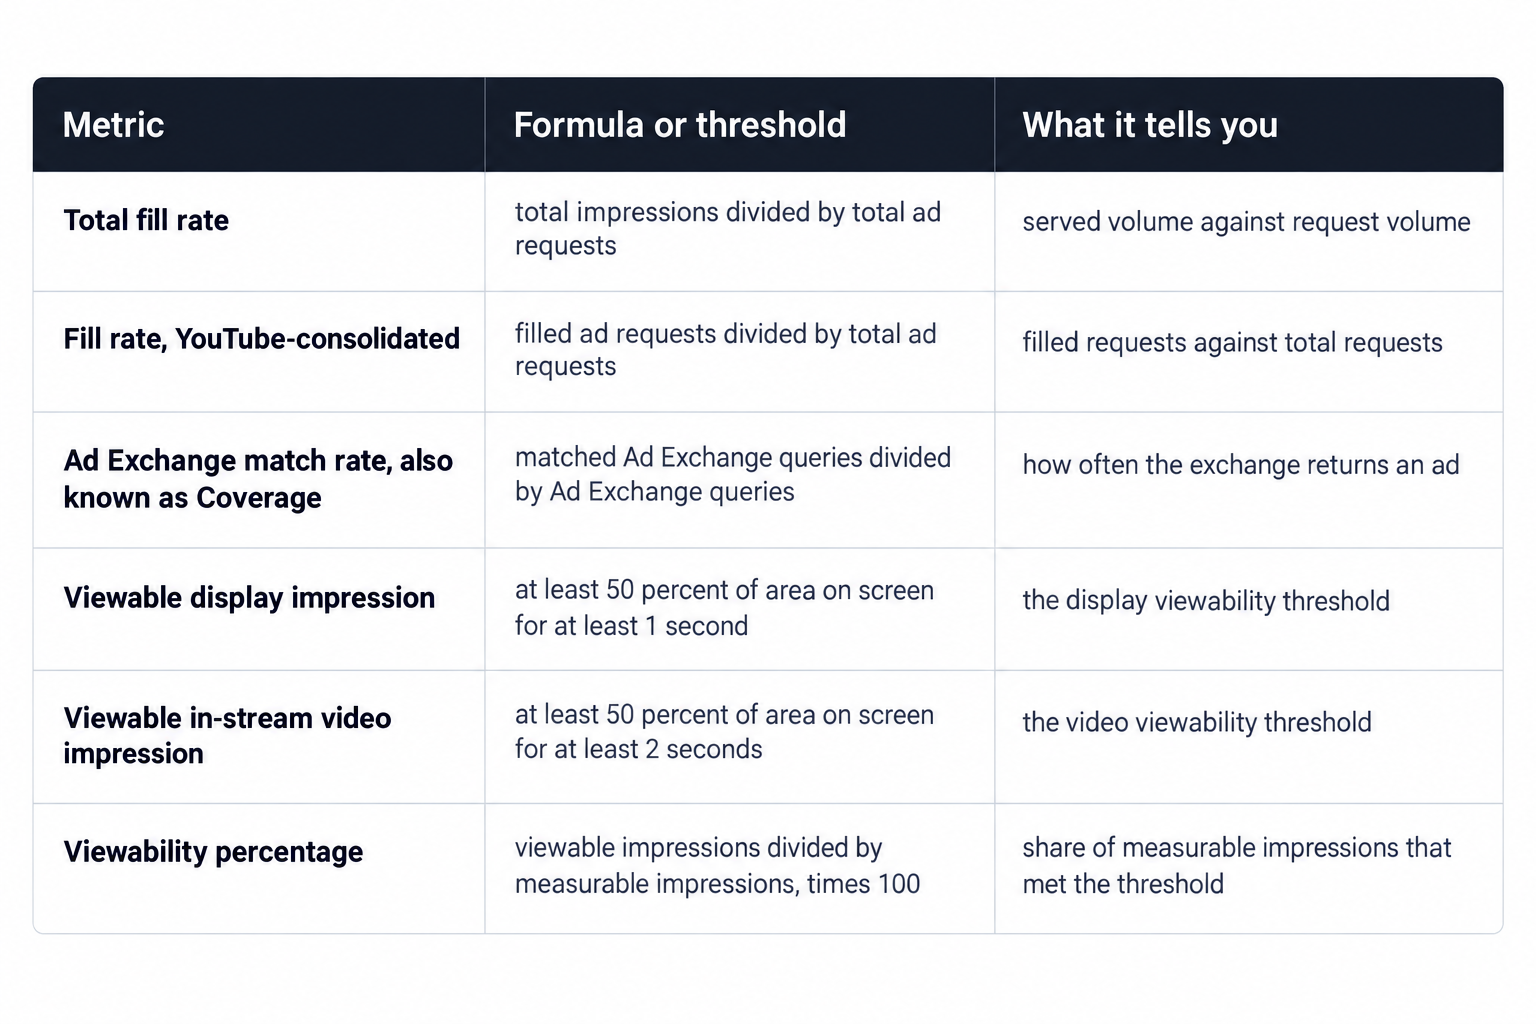
Total fill rate equals total impressions divided by total ad requests. The YouTube-consolidated variant equals filled ad requests divided by total ad requests. The names match, the numerators do not: one counts served impressions, the other counts filled requests. Both formulas, plus viewability and Active View, sit in Google's Interactive report metrics glossary, and that page settles any argument between two dashboards quoting different numbers under the same name.
Fill rate reads like demand health, but request architecture moves it first. Add a second slot per page, a refresh rule or lazy loading, and ad requests climb faster than impressions, so fill rate falls while revenue per page holds. Audit the request side before you blame demand: new formats, request deduplication and refresh logic all drag the ratio down mechanically.
Break the metric down before you act on it. Split by ad unit, by country and by device in separate runs, because a drop concentrated in one country usually traces to demand or targeting, while a drop spread evenly across every slot points back to your own tags. Use time as the tiebreaker: a drop that starts in a single ten-minute window in our console points to a tag or settings change at that minute, and a drop that drifts in over days points to demand.
Match rate: the number people call coverage
The official metric is Ad Exchange match rate: the API defines it as the fraction of Ad Exchange queries that result in a matched query, and the industry also knows it as Coverage. Where fill rate divides served impressions by requests, match rate divides matched queries by queries, so it isolates the exchange's decision to return an ad rather than your request volume.
Coverage is the cleaner signal for monetization changes. Raise a reserve price and match rate moves before revenue does: demand that used to clear the floor stops matching, while the impressions that still clear can pay more. Reserve prices, expected-value ranking and first-price with bid shading decide how often demand clears your floor, and we walk through auction mechanics and reserve prices in detail on the programmatic side of our site.
Read the two metrics together. A fill rate drop with stable match rate points at request architecture; a match rate drop with stable request volume points at demand, floors or both; and a high match rate alongside weak CPMs usually means the floor sits too low and demand clears cheaply. Judge the pair, never either number alone.
Viewability: thresholds and the measurable base
A display impression counts as viewable when at least 50 percent of its area was displayed on screen for at least one second. In-stream video requires 50 percent for at least two seconds. Viewability percentage equals viewable impressions divided by measurable impressions, times 100, and the denominator excludes impressions the browser could not measure. A falling rate can therefore mean fewer viewable impressions, fewer measurable ones, or both, and only the raw counts tell you which.
Pull viewable impressions and measurable impressions in the same report, never the percentage alone. If measurable impressions fall while viewability holds, the problem sits in measurement coverage, often a tag or environment issue, not in layout or player quality. The same glossary carries the Active View formulas, so read those before you quote viewability in a renewal: the gap between viewable and served impressions is where buyers discount and publishers over promise. Keep the thresholds in mind when you compare formats, because two seconds for in-stream video against one second for display makes video viewability structurally harder, not evidence of a broken player.
Pair viewability with revenue in the same pull when you negotiate. A highly viewable slot earning a weak CPM against a modestly viewable slot earning a strong one is a pricing problem, not a placement problem, and only a report that carries both metrics makes that visible. Buyers argue from viewability; argue back with revenue against viewable impressions, which needs the viewable count in the numerator.
Four access layers, four latencies
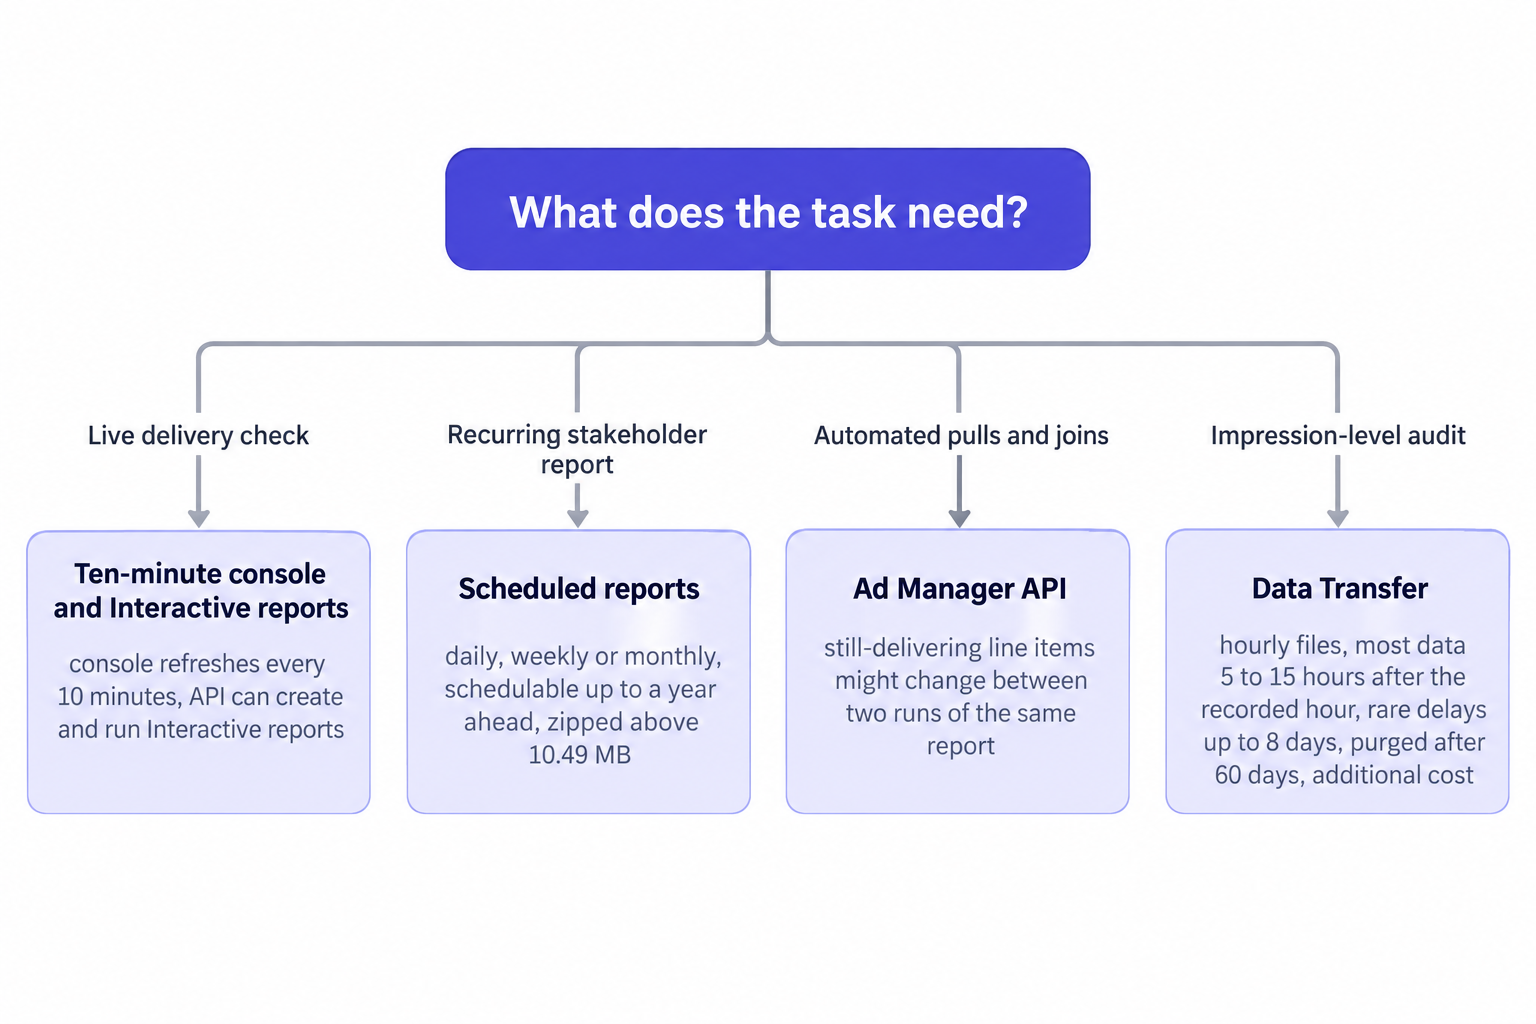
Ad Manager reporting now runs on four access layers, and each answers a different question at a different speed. Pick the layer by the decision at hand, not by habit.
- Interactive reports: build and run on demand in the UI, or create and run them through the API.
- Scheduled reports: daily, weekly or monthly delivery, schedulable up to a year ahead, with Google zipping anything larger than 10.49 MB.
- The Ad Manager API: automated creation, runs and exports for joins and pipelines. Figures for still-delivering line items might change between two runs of the same report, so timestamp every pull.
- Data Transfer: non-aggregated, event-level files in Ad Manager cloud storage buckets, a new set every hour, with most data arriving 5 to 15 hours after the recorded hour.
Those four are Google's layers. We run a fifth on our side because intraday questions have intraday deadlines: at OnlyMedia, our ten-minute reporting console refreshes CPM, fill rate, ad requests, pageviews, revenue, countries, devices and video detail every ten minutes, with API access for programmatic pulls. A delivery anomaly should surface within ten minutes, not in tomorrow's scheduled report, and standardized definitions across the console keep thousands of publishers comparable without a spreadsheet normalization project.
Data Transfer buys event-level truth at a price
Data Transfer files provide non-aggregated, event-level data, and Google pushes them hourly to Ad Manager cloud storage buckets. Most data arrives 5 to 15 hours after the recorded hour, rare delays run up to 8 days, Google purges files older than 60 days, and the feature comes at an additional cost. Google's Data Transfer reports page holds the schemas, delivery details and retention rules, and you should treat it as the contract for any pipeline you build against those files.
Event-level data settles the arguments aggregates cannot. Discrepancy audits between your ad server and a partner's numbers, custom attribution, frequency analysis, and joins between ad events and on-site analytics all require raw rows. Aggregates answer how much; event data answers which impression, in which session, in which country, on which device. When a partner disputes a month, you reconcile rows, not screenshots.
The latency profile sets the discipline. Do not run daily pacing off Data Transfer, because 5 to 15 hours of typical arrival, with rare delays up to 8 days, makes it a forensic layer rather than an operational one. Automate the download, archive the files outside Ad Manager before the 60-day purge, and treat the archive, not the bucket, as the source of truth for anything older than two months. The additional cost buys insurance against disputes, so weigh it against the size of your disputes, not your curiosity.
Build the pipeline deliberately. A download job, an archive that partitions files by date and network, and a small query layer cover most needs, and they keep analysts out of raw buckets. When you join Data Transfer output against your own bid traffic, definitions live in two places: the schemas on Google's page above, and our OpenRTB and VAST documentation for the integration side. Mismatched identifiers, not mismatched math, cause most reconciliation failures, so fix the join keys before you argue about formulas.
Ask Ad Manager: reporting by conversation
On June 18, 2026, Google announced Ask Ad Manager, a multi-turn conversational agent built with Gemini that works only on the publisher's own data. It diagnoses and resolves delivery issues, pulls custom metrics and complex reports from a single prompt, and navigates to the right settings with context-aware links. The beta began that month, with REST APIs and an MCP server to follow later in 2026.
Conversation cuts the clicks between a question and the report that answers it, and the constraint is the interesting part: because the agent works only on your own data, it cannot benchmark you against the market. Treat its output like any report run. Specify dimensions, metrics and date ranges, check for still-delivering line items before you forward numbers, and verify formulas against the glossary when a figure looks wrong. The REST APIs and MCP server will let pipelines call the agent, not just analysts, which turns conversational reporting into an automation surface.
An agent that works on your data inherits your taxonomy, including the naming debt. Publishers with clean line item names, consistent key-value keys and honest labels get answers; publishers whose line items read like internal jokes get confident nonsense. Clean the taxonomy first.
Five failure modes we keep seeing
Most reporting incidents we handle trace back to one of five mistakes, and all five survive every tool migration.
- Comparing fill rate numbers across tools without matching definitions. Total fill rate divides impressions by requests, the YouTube-consolidated variant divides filled requests by requests, and two dashboards can differ legitimately while quoting the same word. Name the formula next to the number wherever it appears.
- Quoting viewability percentage without the measurable base. The percentage excludes unmeasurable impressions, so a change that hurts measurement can masquerade as a viewability win. Publish viewable impressions and measurable impressions beside the rate.
- Running daily operations off Data Transfer latency. The files land 5 to 15 hours late in the typical case, with rare delays running to 8 days, so pacing decisions read stale data. Pace on the console, audit on the files.
- Forwarding figures that include still-delivering line items. Two runs of the same report can differ because delivery continues. Timestamp pulls and flag still-delivering items before anything reaches finance.
- Averaging fill rate across the whole site. One broken slot drags the average and hides which slot broke. Report per ad unit and per format, and let the site-wide number go unquoted.
None of these require new tooling. They require a naming convention, a checklist and an owner for every number that leaves the building.
A cadence that holds
Sequence the layers by decision speed: intraday questions need ten-minute data, daily questions need a stable pull, weekly questions need scheduled delivery, and monthly questions need event-level truth. A cadence that respects those latencies looks like this:
- Watch delivery against the ten-minute console a few times per day, and investigate anomalies in the hour they appear, not in next week's scheduled report.
- Pull yesterday once per day through the API, timestamp each run, and flag still-delivering line items so provisional figures never reach finance.
- Schedule stakeholder reports weekly or monthly, split dimensions to stay under the 10.49 MB zip threshold, and fill the schedule a year ahead so nobody rebuilds recurring reports by hand.
- Reconcile monthly against Data Transfer, archive the files before the 60-day purge, and settle disputes with event rows rather than aggregate screenshots.
Reporting ends in payment, and fixed terms make the revenue line worth reconciling. We pay publishers Net 30, CPM based, no chasing, no sliding terms, and every publisher in our programmatic demand network clears at least one million monthly pageviews. When the terms never move, delivery is the only variable left, which is exactly what the stack above measures.
Rebuild what the sunset killed, quote the formulas rather than the folklore, and keep the layers straight: the console for right now, Interactive reports for today, scheduled reports for the calendar, Data Transfer for the audit. The publishers with the best reporting are not the ones with the most charts. They are the ones whose numbers arrive on schedule, match their invoices, and survive a row-level check.