Debugging Prebid.js: Essential Chrome Extensions for Ad Ops
When a header bidding auction fails, it fails quietly. The page renders, the slot exists, the ad server serves a fallback or a low-value line item, and revenue leaks one request at a time. Three of nine bidders may have timed out, the top bid may never have reached the ad server, and nothing on the page announces any of it. The evidence sits in the browser: bid objects, auction timing, GPT slot state, console output. Two Chrome tools surface that evidence fast, Professor Prebid for the Prebid.js side of the auction and the Google Publisher Console for the GPT side, and running them in a fixed order turns an afternoon of console crawling into a short, repeatable routine.
Start with the debug flag and the console commands
The official Prebid.js troubleshooting flow begins with a URL parameter, not an extension. Append pbjs_debug=true to the page URL and Prebid.js exposes verbose logging and JavaScript errors in the console. Two commands carry most of the weight: pbjs.getBidResponses() returns every bid the auction received, and pbjs.getAllWinningBids() returns the bids Prebid.js passed along to the ad server. Read the verbose log for adapter errors before you read any bid data, because a JavaScript error inside an adapter removes that bidder from the auction without a visible symptom. When the response list is full and the winning list is empty, the failure sits in the handoff to the ad server. When the response list is thin, the failure sits in the auction itself, and the panels below show why.
One console gotcha costs everyone a few minutes eventually. If the console returns undefined for the pbjs commands, the wrapper probably lives inside an iframe, so select that frame in the console's context dropdown and run the command again. The URL parameter works from anywhere; the commands need the right frame context.
Raw console output answers those questions slowly. It shows one auction at a time, it mixes adapter warnings with bid payloads, and comparing CPMs across nine bidders means scrolling a wall of objects. It also invites mistakes: a cached page hides the config change you just deployed, and a mistyped command costs a minute you do not have during an incident. Publishers above one million monthly pageviews run this workflow daily, and a daily workflow deserves a panel with tabs.
Professor Prebid: the Prebid.js side of the auction
Professor Prebid is an open source Chrome extension for debugging and troubleshooting on publisher websites using Prebid.js. Install it from the Professor Prebid Chrome Web Store listing, which describes the tool as an "extension to validate your prebid.js setup, list AdUnits and bids, visualise latencies and timings of your webpages header-bidding partners, override CPMs and filter bidders for troubleshooting". Five capabilities map onto five questions: is the setup correct, what did the auction receive, who answered late, what happens if this bid wins, and what happens without this bidder. Most debugging sessions on a Prebid site reduce to a combination of those five.
The extension lays the auction out across tabs: AdUnits, Bids, Auction Timeline, User IDs, and further details of the ad auctions. Read AdUnits first, because a div ID typo or a mismatched size registers no ad unit at all, and every downstream symptom follows from that. Bids shows what each bidder returned per ad unit, with the CPM and status of every response, so underpriced inventory appears as a pattern instead of a hunch. User IDs shows whether the identity modules populated for the session, which matters because some bidders read an empty identity payload as lower-value inventory and shade their bids accordingly. The official Professor Prebid user guide documents every tab and feature, and it earns a bookmark, because the panel exposes more detail than anyone absorbs on first use.
The Auction Timeline: where latency turns into money
Latency drains header bidding revenue in one specific way: a bidder that responds after the auction window closes earns nothing, however high its CPM would have been. The Auction Timeline tab shows when each bidder answered relative to the auction, which turns a vague suspicion into a visible pattern. A bidder that consistently answers after the window has three possible remedies, and each carries a cost: extend the timeout and pay in page latency, drop the bidder from that setup and pay in lost competition, or move that demand server-side and pay in integration work. Use the CPM override and the bidder filters in the extension to rehearse each remedy in the browser before committing a code change.
Record what you see before you act on it. One slow pageview proves little, because network noise explains plenty of single observations; the same bidder answering late across repeated sessions proves a pattern, and patterns justify timeout changes. Log the bidder, the ad unit, and the offset you observed each time, because the aggregate is what you take to the timeout discussion, not the anecdote.
The Tools tab: controlled experiments with the Debugging Module
The Tools tab can enable the Prebid.js Debugging Module directly, and that module enables intercepting bids and replacing their contents with data for testing purposes. In practice, it turns the live page into a controlled experiment. Replace a bid's contents to reproduce a rendering bug without waiting for the offending creative to serve on its own. Push a CPM above a floor to confirm that the matching line item and its key targeting fire on the ad server side. Filter down to a single bidder to isolate an intermittent failure that only shows up with one adapter.
Keep the experiments clean. Change one variable per test and reload between tests so each run gets a fresh auction. Note the Prebid.js version alongside your findings, because adapter behavior differs across releases and a reproduction from an old version can send you chasing a bug that a newer release already fixed. The module changes what that browser session receives, so treat its output as test data rather than a read of production, and switch it off before you draw any other conclusion, because an override you forgot to disable explains a week of confusing numbers downstream.
The GPT side: the Google Publisher Console
Prebid.js ends where GPT begins. The auction hands winning CPMs to the ad server as key-value targeting, and GPT decides what actually serves into the slot. The Google Publisher Console documentation covers the Google side of that handoff, and the console opens three ways: run googletag.openConsole() in the console, append ?google_console=1 to the URL of any page that includes GPT, or press Ctrl+F10. Three tabs organize the view: Ad Slots lists every slot defined on the page along with its delivery state, Page Request shows what the ad request carried, and Configuration shows the page-level GPT settings. When you suspect the loss sits between Prebid and the served creative, start with Ad Slots.
The cross-check that closes most cases runs between the two tools. Compare pbjs.getAllWinningBids(), or the Bids tab in Professor Prebid, against the Ad Slots tab. If Prebid passed a winning bid and the slot still served a house line item, the failure sits in ad server targeting: the line item keys do not match, the line item sits inactive, or the price band granularity does not cover the passed value. If the Ad Slots tab shows that the slot never fired, the problem lives in the page, the div, or the GPT definition, and no Prebid setting will fix it.
The URL parameter suits the moments when a shortcut does not: recorded walkthroughs with clients, review sessions on machines you do not control, and screen shares where you would rather send a link than reach for the keyboard. Agencies auditing client properties lean on the parameter for exactly this reason.
Four instruments, one order of operations
Four tools cover the client-side stack, and they overlap less than people assume. The pbjs_debug=true parameter with the console commands exposes raw auction data and JavaScript errors. Professor Prebid turns that data into tabs, adds the timeline view, and can override CPMs and filter bidders. The Debugging Module, reachable from the Tools tab, intercepts and replaces bid data for tests. The Google Publisher Console shows what GPT did with whatever Prebid handed over. Matching the question to the tool separates a short diagnosis from an afternoon of guessing.
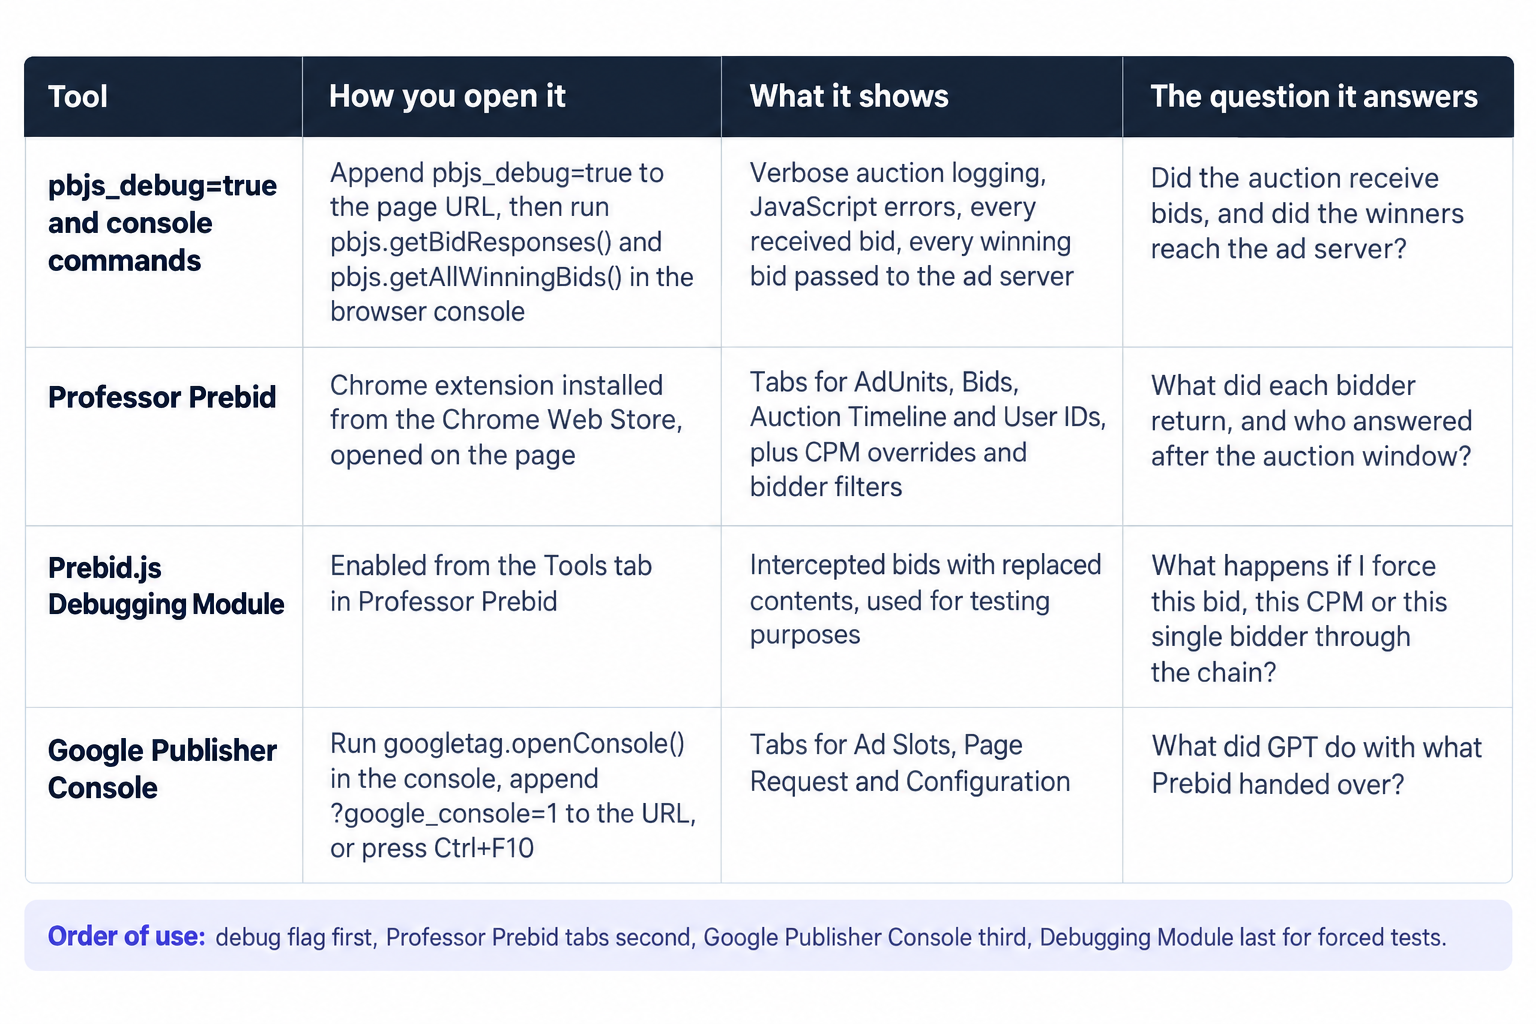
Use them in that order during an incident: console first for errors, panel next for bid data, ad server console third for the handoff, module last for forced tests. The worked run below applies the sequence to one concrete failure.
A worked run: the silent sidebar slot
Take a 300x600 sidebar slot that stopped filling on desktop while the same ad unit still fills on mobile. Six checks, in this order, route the failure to a single layer.
- Reload the page with
pbjs_debug=trueand read the console first. A JavaScript error in an adapter removes that bidder silently, and errors point at broken configuration faster than bid data does. - Open Professor Prebid and read the AdUnits tab. Confirm that the sidebar ad unit registered with the sizes you expect, because a missing size means bidders never bid on the 300x600 at all.
- Read the Bids tab. CPMs below your floors mean the slot priced out, and the fix sits in floor strategy rather than in code.
- Read the Auction Timeline. Bidders answering after the window indicate a latency problem, and no floor adjustment repairs that.
- Press Ctrl+F10 and open the Google Publisher Console. Check the slot's state in Ad Slots and confirm whether a line item targeted the keys Prebid passed.
- If the targeting chain looks intact, enable the Debugging Module from the Tools tab, push a CPM above your floor, and watch for the correct line item and creative to render. If they do, live demand priced out today and the auction works. If they do not, the fault sits in the ad server, and the module just saved you a ticket to the wrong team.
Six steps route the failure to one of three layers: the page, the auction, or the ad server. Run them in that order and you stop arguing about which layer owns the problem, which is the difference between a fix and a workaround.
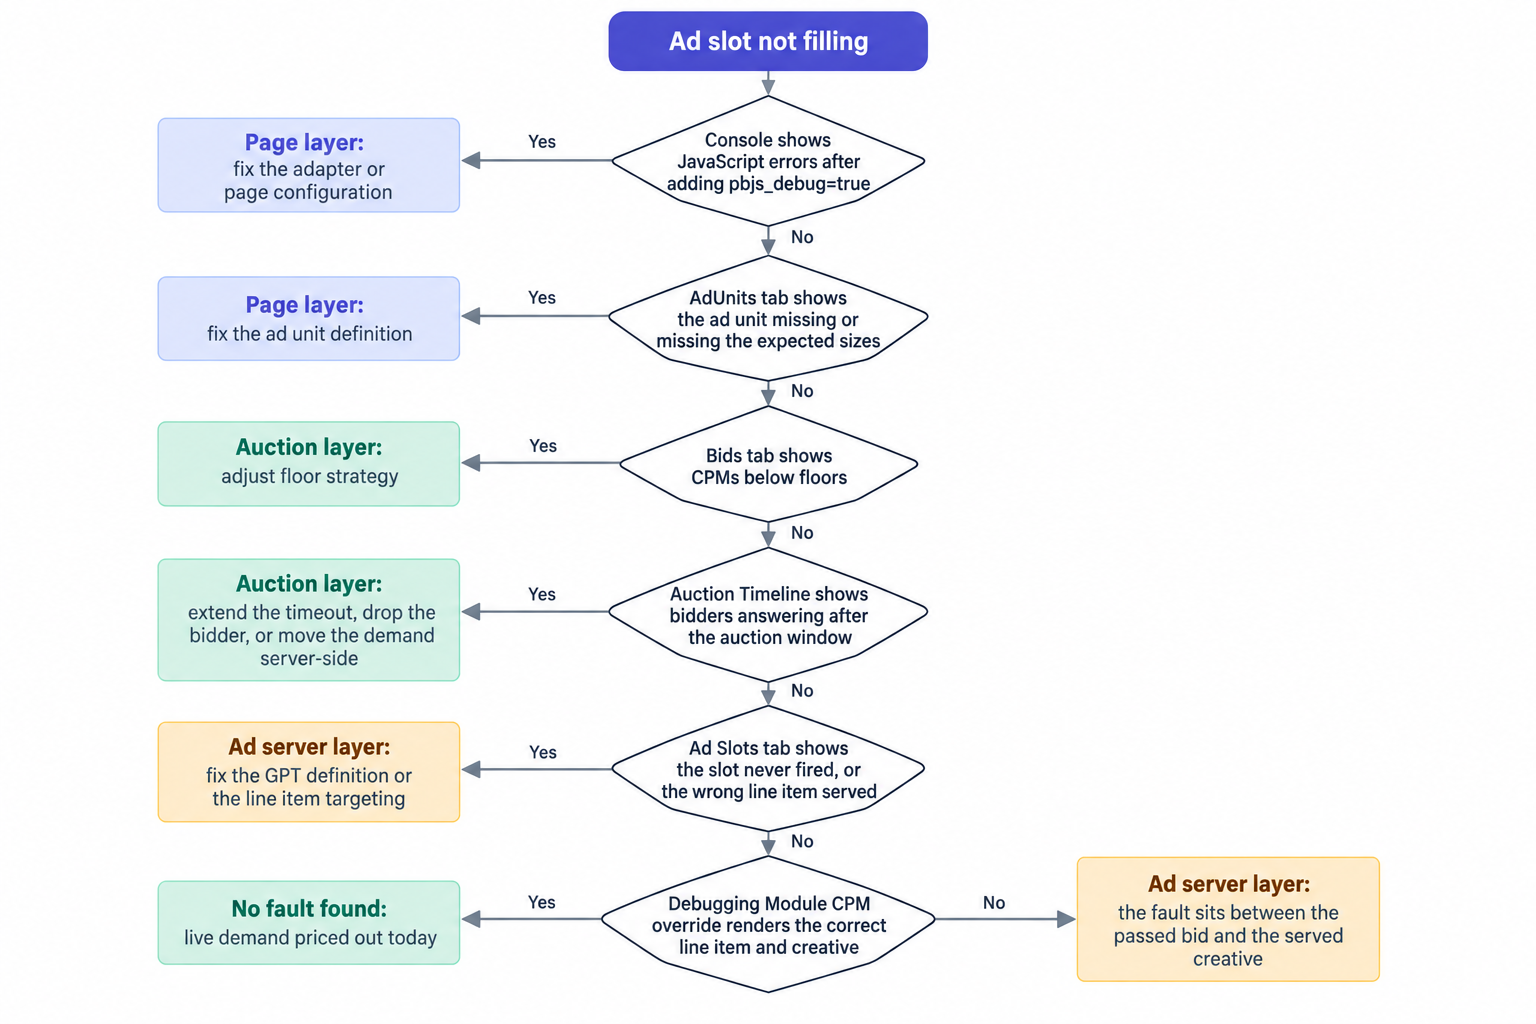
Pin the tree in the runbook. The value of a fixed sequence is that two people running it on the same failure reach the same layer, and the escalation package writes itself from whichever branch ends the run.
Where browser extensions stop: server-side demand and OpenRTB seats
Client-side extensions read client-side auctions. When demand moves server-side, the browser sees only the result of a server-side auction, not the requests and responses inside it, and the same limit applies to demand arriving through an OpenRTB seat. Debugging then shifts from panels to logs: request IDs, seat-level reports, and timestamped bid records from the partner that operates the server-side container. Ask that partner for a trace of the specific ad request, align on timezones before comparing timestamps, and correlate the page's ad request ID with the seat's records.
At OnlyMedia we integrate OpenRTB 2.6 seats and Prebid for both header and server-side demand, and that split decides ownership: an adapter problem belongs to whoever runs the client-side wrapper, and a seat problem belongs to the partner operating the seat. Our OpenRTB and VAST API documentation specifies the fields and parameters each seat expects, which is the reference you need when a bid loses its way between server and page.
Video adds one more blind spot. A VAST response that errors partway through the chain leaves the player holding the impression, and no Chrome panel walks the tag chain for you, so video debugging ends in log inspection and tag validation more often than in browser panels.
Escalate with a package, not a complaint
When a fix needs a vendor, the quality of what you send sets the response time. Package the page URL with pbjs_debug=true attached, tab captures from Professor Prebid for the affected ad units, the Google Publisher Console output for the affected slots, the Prebid.js version, and a HAR file of the page load. Name the ad unit codes and placement sizes in the ticket. Our publisher and partner support desk works from delivery data refreshed every ten minutes, so the evidence in the ticket maps directly onto what we see on our side, and the first reply lands on the right layer instead of three replies deep.
Confirm the fix in the reporting console
A fix counts only when delivery data confirms it. Track the affected placement's fill rate, CPM, and ad requests before and after the change, and slice by country and device, because header bidding failures hide in single segments: a bidder that only serves European traffic can break for EU users while blended numbers look healthy. Confirm it in the reporting console refreshed every ten minutes, which carries CPM, fill rate, ad requests, pageviews, revenue, country, device, and video detail; its API access lets you pull the affected ad unit programmatically and alert on the delta instead of checking by hand. For video placements, the video detail settles the recurring argument about which side lost the impression, the player or the demand path. A change that holds across a few refresh cycles with the numbers you expected is a change you can close the ticket on.
Running the audit across a portfolio
Agencies get the compounding version of this workflow. The extensions travel with the browser profile, so the same run order applies to every property in the account, and findings become comparable across clients instead of anecdotal. Keep a per-property record of what each step showed, because a failure that recurs across a portfolio points at a shared template or a shared wrapper configuration, and a failure that appears on one property points at that property's code. A standardized sequence also makes the audit something you can delegate: a junior executes the six steps and escalates with the package, and the senior reviewer reads evidence instead of reconstructing it.
The habit and the demand behind it
Debugging recovers revenue only when the demand behind the auctions competes. Our curated programmatic demand network works with thousands of publishers, each above one million monthly pageviews, and we pay publishers Net 30, CPM based, with no chasing and no sliding terms, so the ceiling on what any debugging routine recovers sits with demand quality, not with payment friction. Book the audit weekly: debug flag, panel, timeline, module, ad server console, report. The failures it catches are small individually and material in aggregate.